Credits
-
Pou Auaha / Creative Director
Greg More - Oom Creative
-
Ringatoi Matua / Design Directors
Greg More - Oom Creative, Marco Cher-Gibard - Spatial Sound, Chris McDowall - Data consultant
-
Ngā Kaimahi / Team Members
Rebecca Lal, Ben Bradford, Louise Langdon, Guy Annan, Liam Brown, Gilbert Zhao, Kara Woodward, Kelly Skelton -
Kaitautoko / Contributors
Auckland Council Te Kaunihera o Tāmaki Makarau, Auckland Transport, Data Ventures, iNaturalist.nz, Independent Māori Statutory Board, Land Information New Zealand Toitū te whenua, Ministry for the Environment Manatū Mō Te Taiao, NIWA Taihoro Nukurangi, Stats NZ Tatauranga Aotearoa, Te Tari Taiwhenua Department of Internal Affairs, Watercare, www.māorimaps.com and Te Potiki National Trust Limited

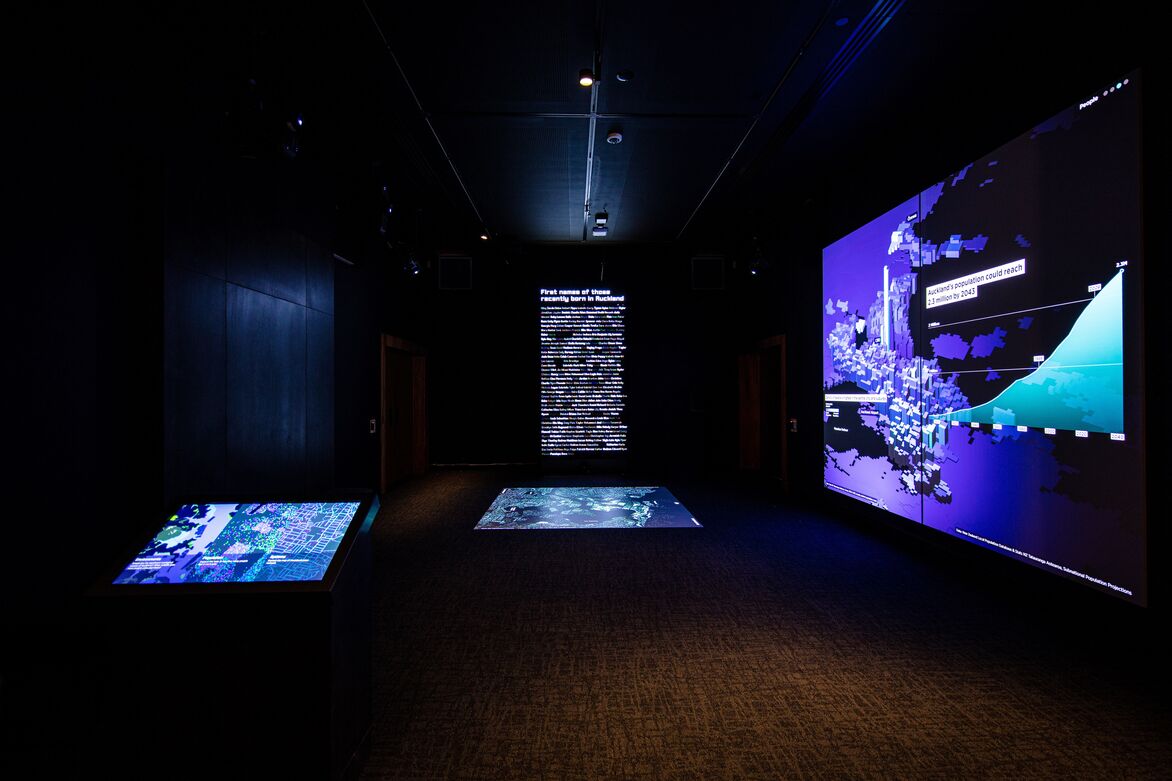
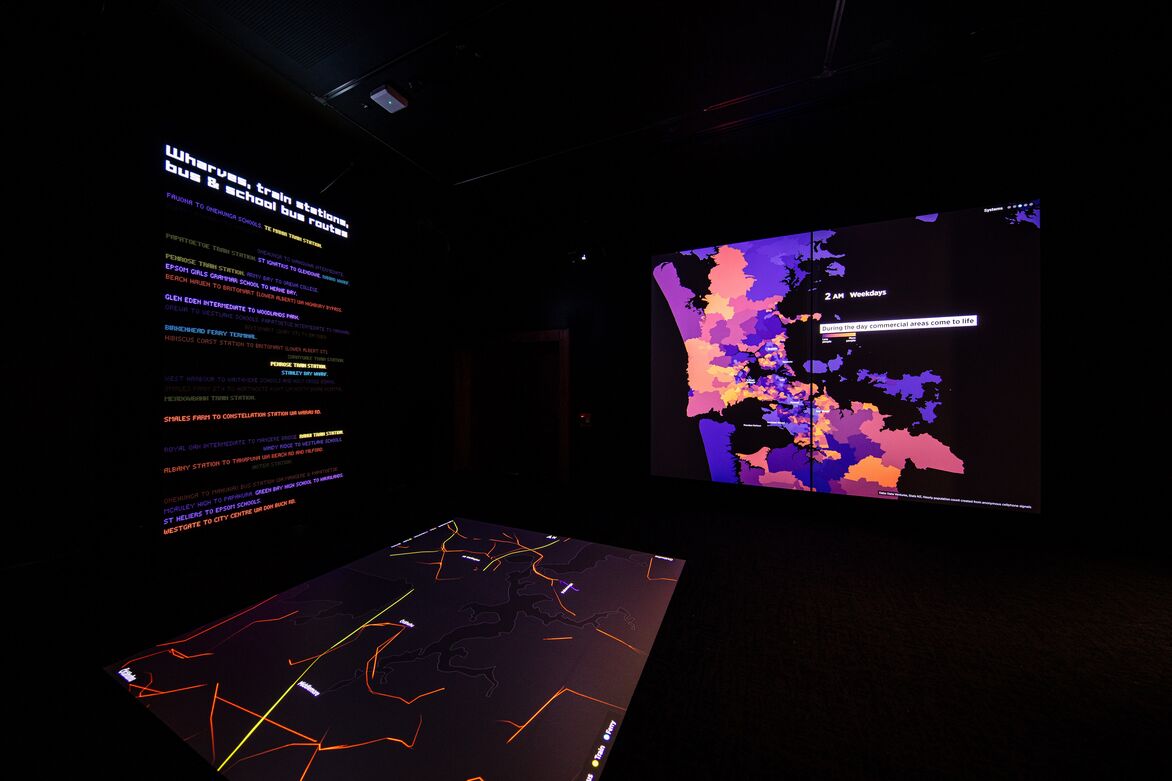
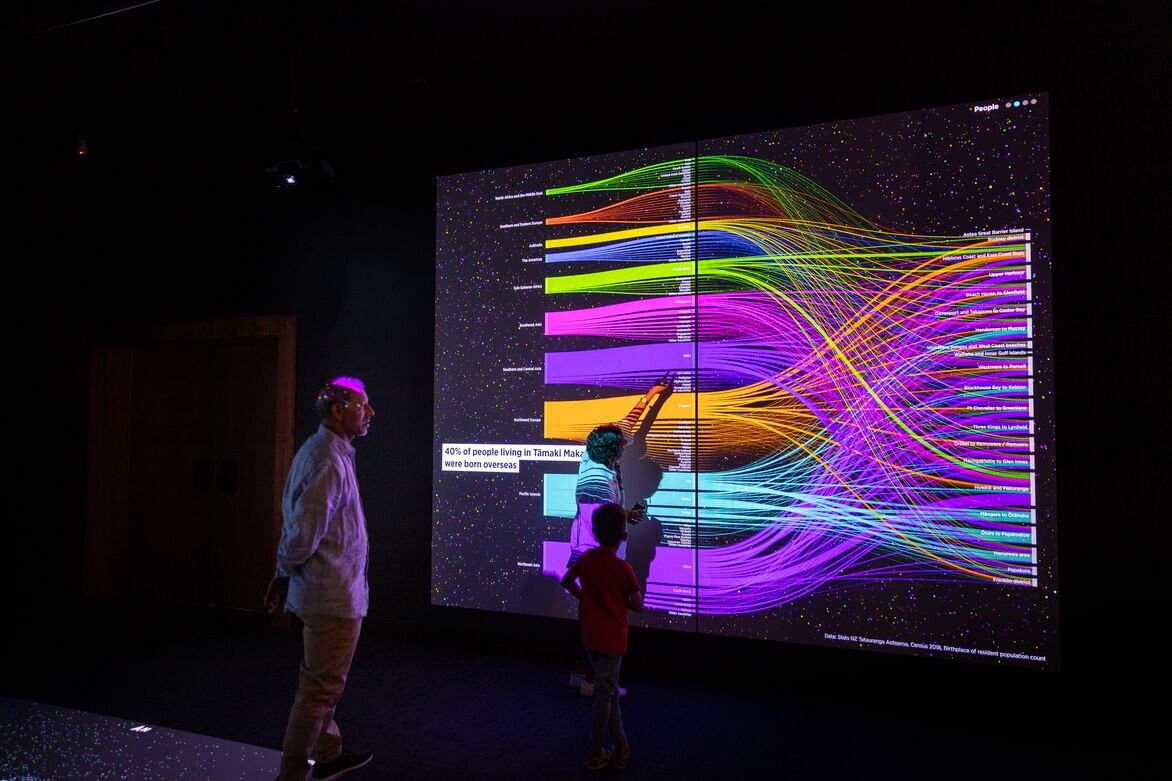
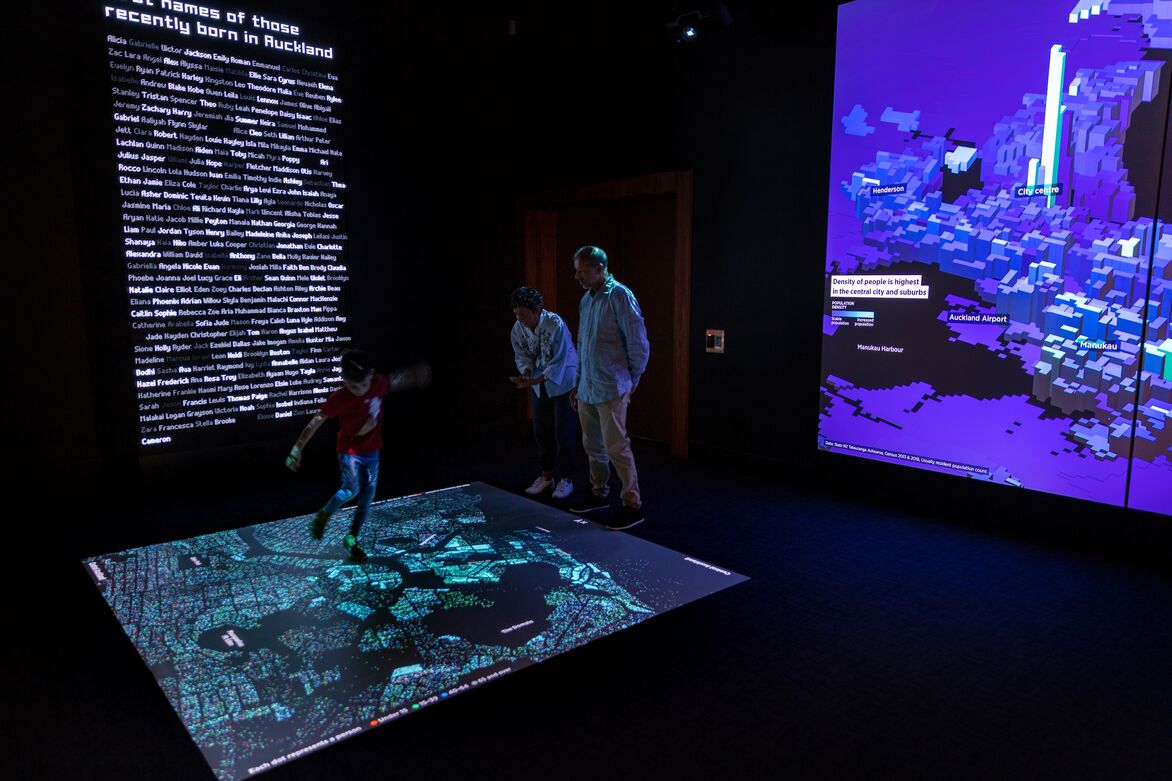
Description:
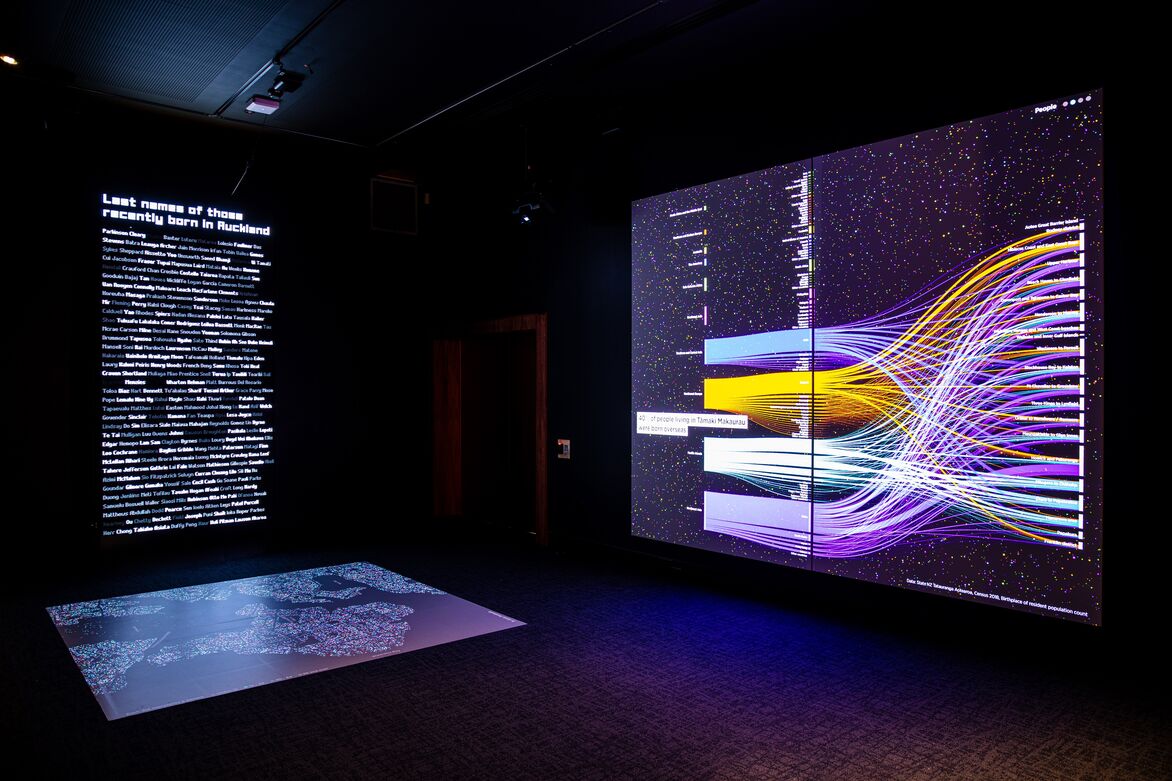
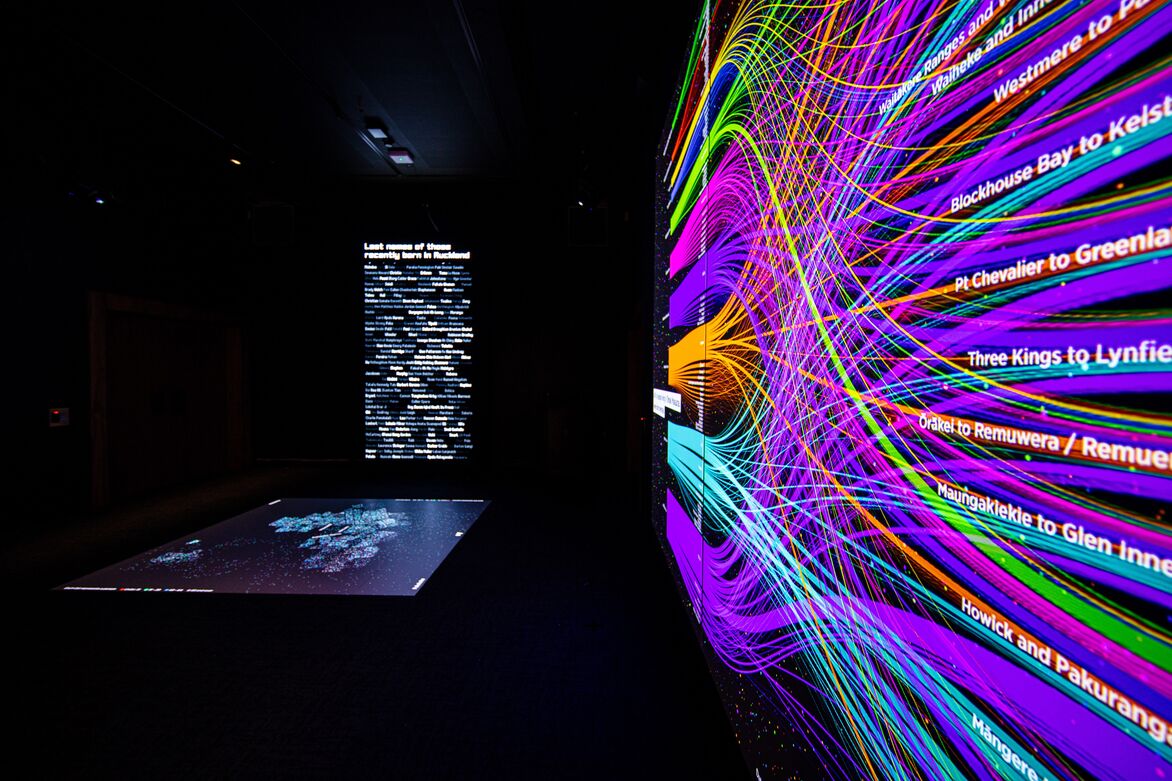
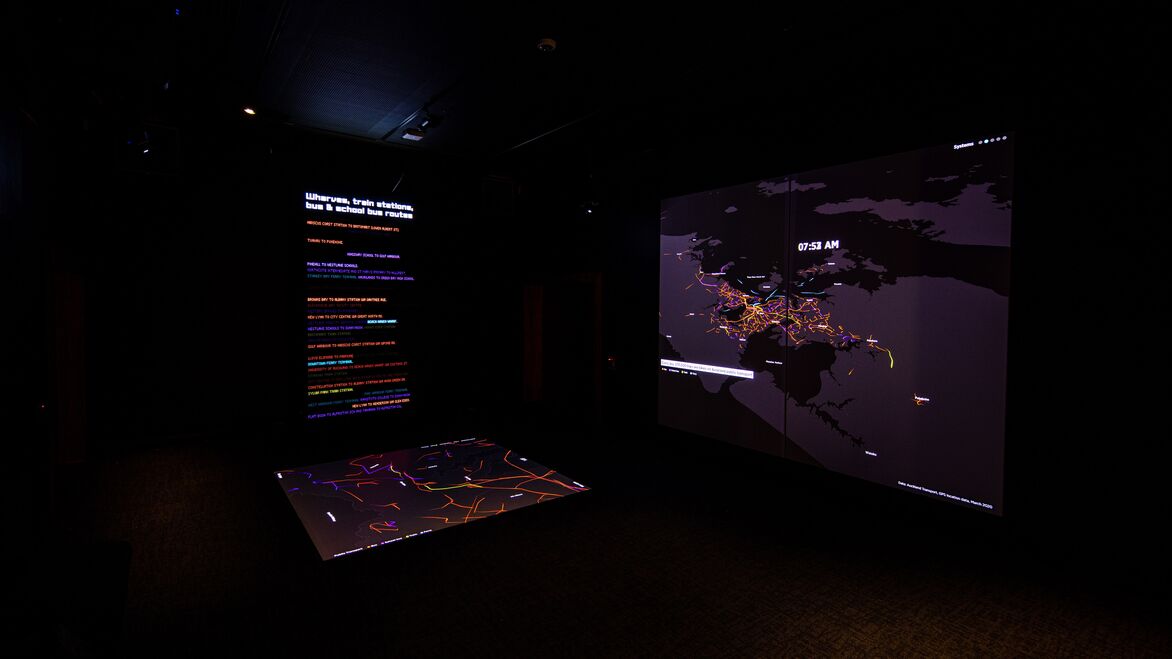
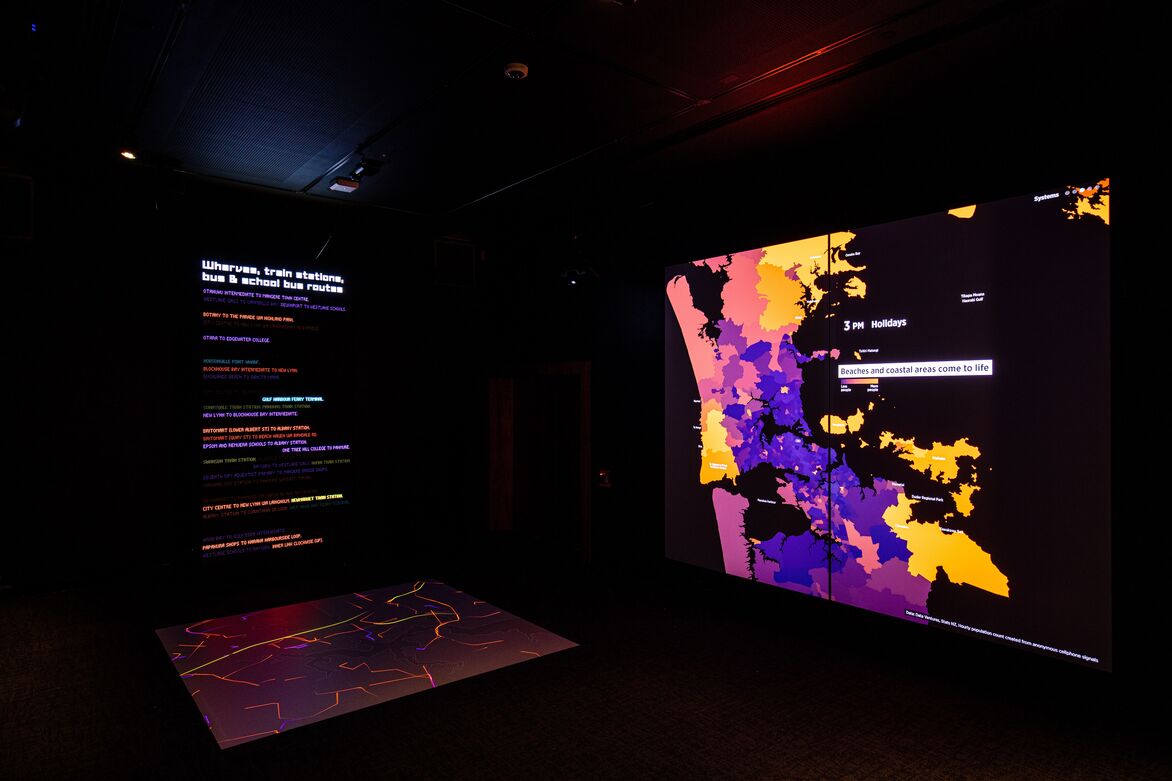
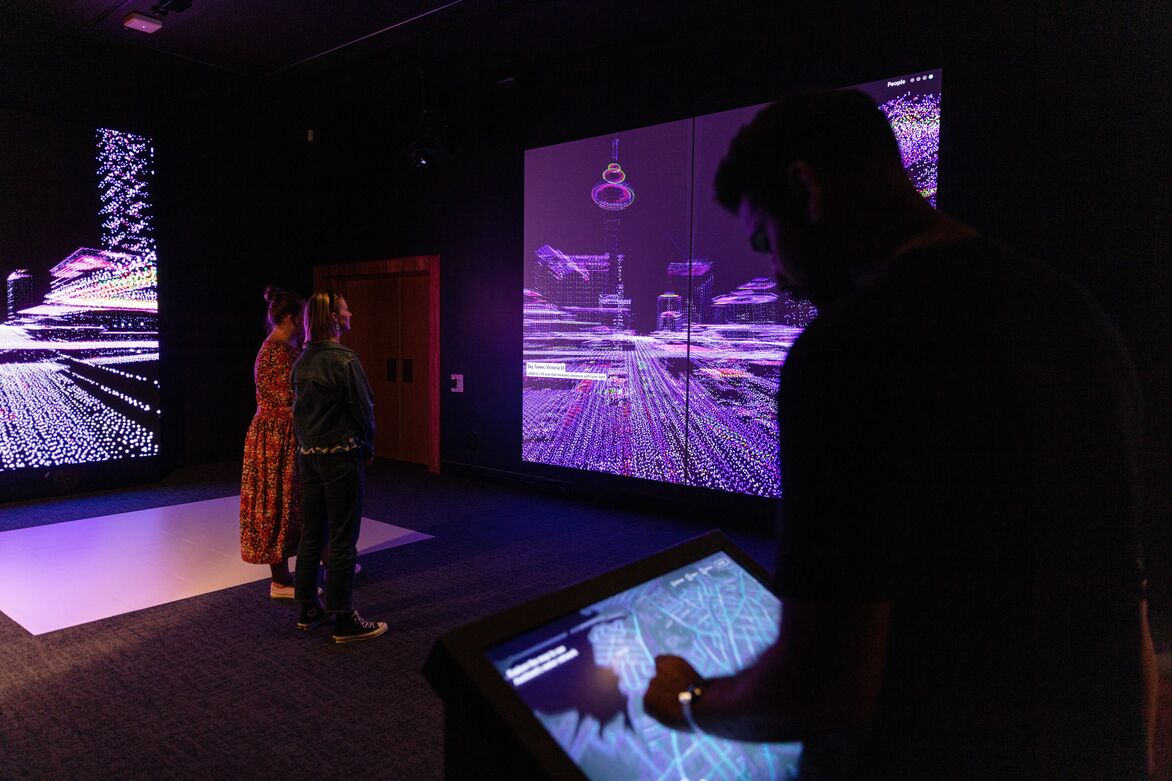
Millions of pieces of data have been crunched to create Rarau mai Living city, an immersive gallery of dynamic data visualisations where the walls and floor are alive with projections illustrating who we are as Aucklanders and the places we inhabit. This experience sits in our Tāmaki Herenga Waka: Stories of Auckland gallery, which reflects Auckland’s people and places throughout time and space.
Living city is a first for the Museum in devoting the entire space of a gallery (one of four) to data as a creative storytelling medium. Data can be analytical but here it is also cultural and experiential. Living City uses data about Tāmaki to visualise the themes of people, environments, and systems.
Most of us never see the data we’ve helped to create – Living city makes this data visible. The experience resonates with many of our visitors who are drawn in by the dark immersive space and dynamic projections. Once inside the gallery there are many ways to interact with the experience: taking a seat and watching the projections, playing with colour, movement and pattern on the floor projections, discovering data specific to your neighbourhood on the touchscreen. Visitors are physically surrounded by and imaginatively immersed in data.
By taking a different approach to storytelling and showing data in a visually compelling way, we have been able to reach audiences who do not engage with traditional presentations of data and who may be inspired to now consider data as relevant to their lives.